AN0014 – Optimal Quantification of THC in Blood
INTRODUCTION
The number of regular cannabis users in the world is estimated
at 183 million people[1]. It is illegal to drive a vehicle whilst
under the influence of cannabis. The active ingredient in cannabis is
delta9-Tetrahydrocannabinol (Δ9-THC). Common side effects includes the feeling
of euphoria, hallucinations, relaxationand even sedation. Post ingestion,
Δ9-THC is metabolised into the inactive ingredient Tetrahydrocannabinolic Acid
(THCA/ THC- COOH).
Suspected drug drivers are often subjected to a screening test
of cannabinoids in saliva. A positive result must then be confirmed by the
presence of Δ9-THC in a blood sample; by gas chromatography. Quantification of
THCA can indicate long term use of the drug. Drug detection limits are set by
government laws and vary from country to country. The limits in the United
Kingdom and Canada is 2ng/mL whereas in France the limit is 1ng/mL.
EXPERIMENTAL
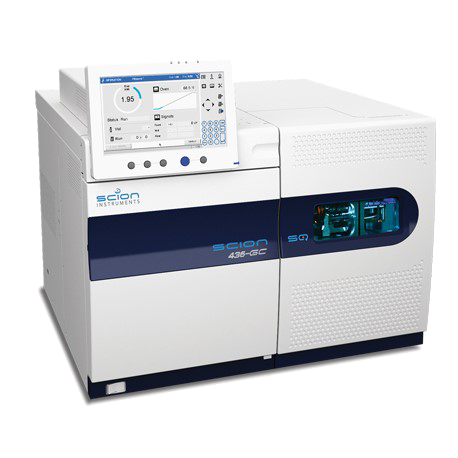
A SCION 456 GC coupled with the SCION Single Quad Mass Spectrometer was configured for cannabinoid analysis in blood.
Calibration standards were prepared with a range of 0.5ng/mL
to 10ng/mL for Δ9-THC and 2.5ng/mL to 50ng/mL for THC-COOH, with 20μL of
internal standard (Δ9-THC-D3 and THC-COOH-D3).
Biological samples were prepared using the following method.
20μL of internal standard was added to 1mL of blood sample. 200μL of acetic
acid (10%) and 5mL of hexane/ethyl acetate (9-1 V/V) were added before being
centrifuged for 10 minutes at 4000rpm. The organic phase was removed and
evaporated at 50°C. The dry extract was then derivatised with 50μL of
BSTFA+1%TCMS for 40 minutes at 80°C. 2μL was injected into the split/splitless
injector.
Analytical
conditions can be found in Table 1.
Table 1. Analytical Conditions of the GC-MS
|
Conditions |
|
|
S/SL Injector |
280°C, splitless, 2μL |
|
Column |
SCION-5MS 15m x 0.25mm x 0.25μm |
|
Oven |
50°C (hold 0.10min) 15°C/min to 260°C (15.30 mins) 20°C/min to 300°C (18 mins) |
|
Carrier Gas |
Helium, 1mL/min |
|
Source |
250°C |
|
Transfer Line |
310°C |
|
Mode |
Positive, 70eV |
|
THC Ions |
371, 386 |
|
THC-COOH Ions |
371, 473 |
RESULTS
The calibration curves for both THC and THC-COOH can be found
in Figures 1 and 2. The linearity for both cannabinoids were excellent.
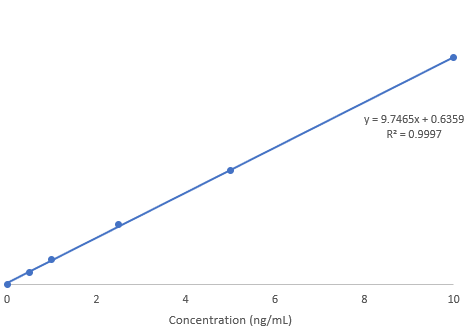
Figure 1. Δ9 THC Calibration
Curve
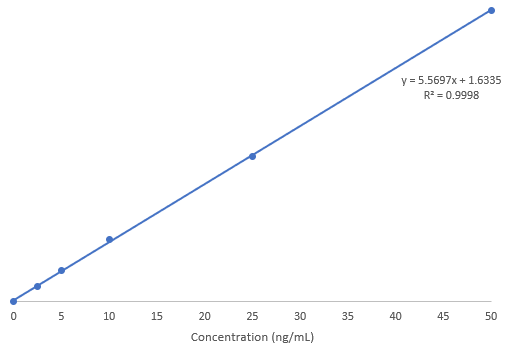
Figure 2. THC-COOH Calibration Curve
The sensitivity of the SCION SQ MS is excellent, thus
exceeding the lowest quantification limit set in France (1ng/mL) , for Δ9-THC.
The limit of detection for Δ9-THC is 0.2ng/mL with the limit of quantification
0.5ng/mL whereas the limit of quantitation of THC-COOH is 2.5ng/mL.
Reproducibility (n=10) and repeatability (n=5) of the system
were tested using consecutive injections of Δ9-THC at both 0.20ng/mL and
0.5ng/mL plus THC-COOH at 2.5ngmL. Analysing the sample spiked at the limit of
quantification shows the high reliability and robustness of the results. Table
2 details the performance of the SCION GC-MS.
Table 2. Reproducibility and repeatability of Δ9-THC and
THC-COOH
|
Analyte |
n |
Concentration (ng/mL) |
RSD (%) |
|
Δ9-THC |
10 |
0.5 |
6.8 |
|
Δ9-THC |
5 |
0.20 |
3.8 |
|
THC-COOH |
5 |
2.5 |
5.5 |
Figure 3 shows the chromatogram from
seven consecutive injections, of 0.5ng/mL Δ9-THC, which were then overlaid in
the Mass Spectrometry Work Station software.
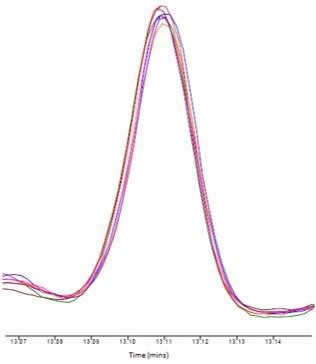
Figure 3. Overlay of 7 consecutive injections of
0.5ng/mL Δ9-THC
A
blood sample was obtained from a cannabis smoker. The cannabinoids were
extracted from the plasma and ran using the same method. Figure 4 shows the
total ion chromatogram (TIC) of both Δ9- THC and THC-COOH.
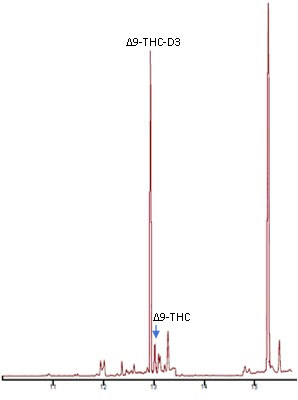
Figure 4. TIC of blood sample from cannabis user
CONCLUSION
The analysis of cannabinoids from biological matrices is made easy with the SCION GC-MS. The highly sensitive and robust instrument has exceptional limit of detection for both Δ9-THC and THC-COOH. With an LOD of 0.2ng/mL and LOQ of 0.5ng/mL, for Δ9-THC, these limits exceed the requirements specified by the laws in UK, Canada and France. Additionally, the cannabinoid analyser is capable of detecting THC- COOH at concentrations as low as 2.5ng/mL, with excellent repeatability for both cannabinoids.
REFERENCES
[1] United Nations Office on Drugs and Crime (2017). Statistics and Trends in Illicit Drugs. [online] United Nations, p.1. Available at: https://www.unodc.org/wdr2017/field/WDR17_Fact_sheet.pdf [Accessed 11 Dec. 2018].
