Maintenance Center
What are Absorption, Excitation and Emission Spectra?
What are Absorption, Excitation and Emission Spectra?
In
this blog post, the differences between molecular absorption, excitation and
emission spectra are explained.
Absorption
Spectra

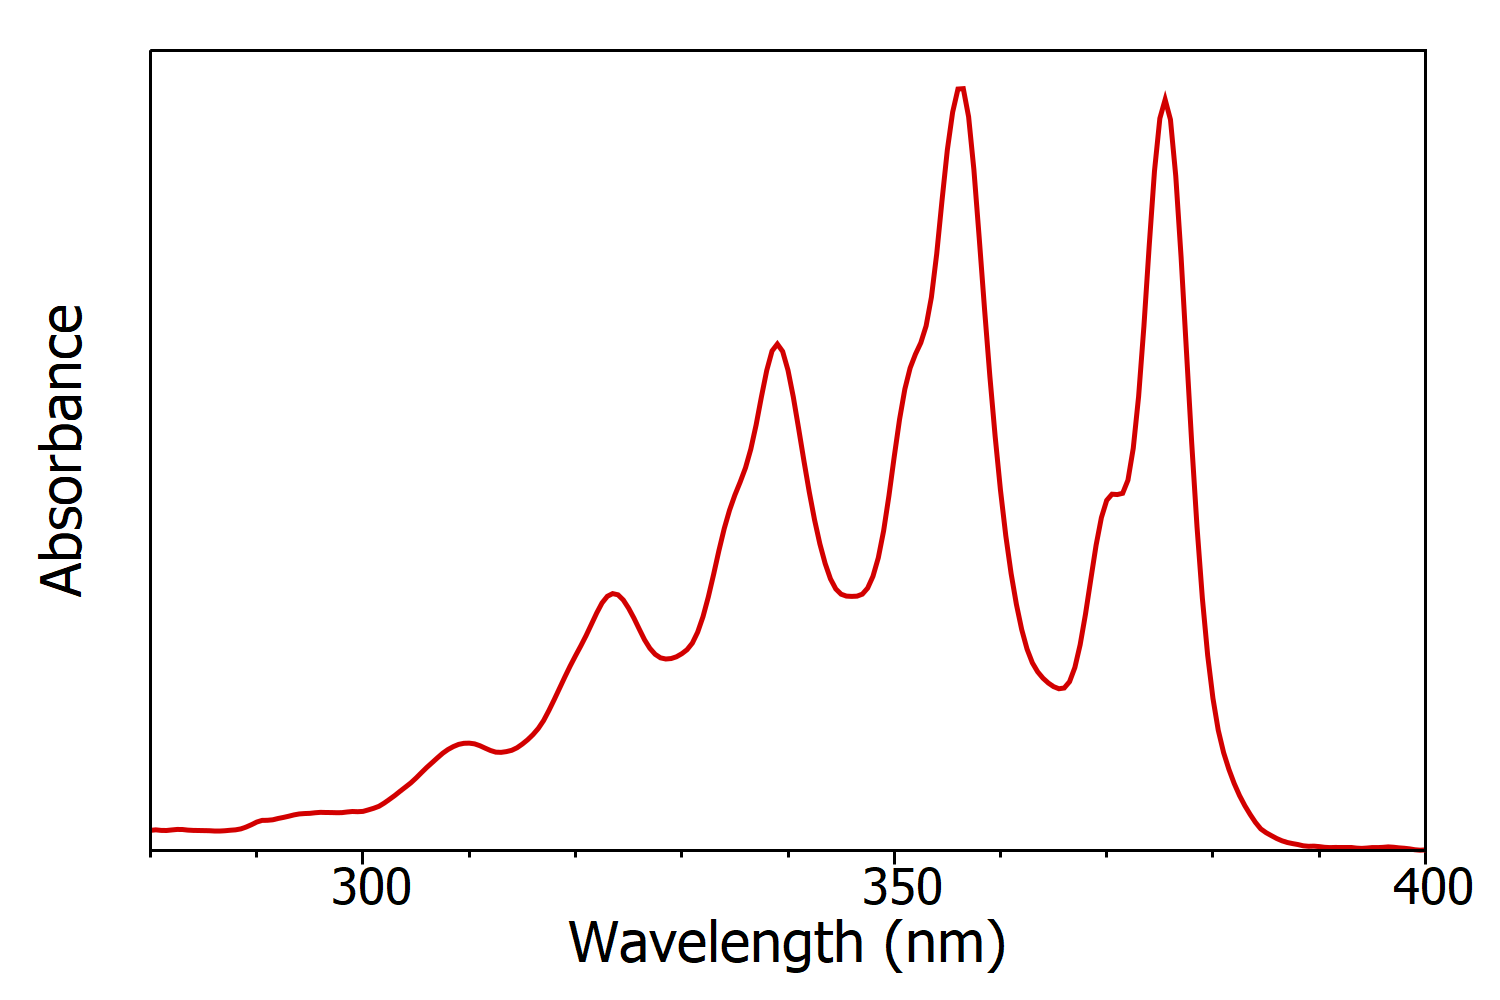
Figure 1: Absorption spectrum of anthracene in cyclohexane measured using the FS5 Spectrofluorometer. Experimental parameters: Δλ = 1 nm.

The absorbance is linearly proportional to the molar concentration of the sample; which enables the concentration of the sample to be calculated from the absorption spectrum using the Beer-Lambert Law.

Figure 2: Schematic of the measurement of absorption spectra in a spectrophotometer.
Excitation
Spectra

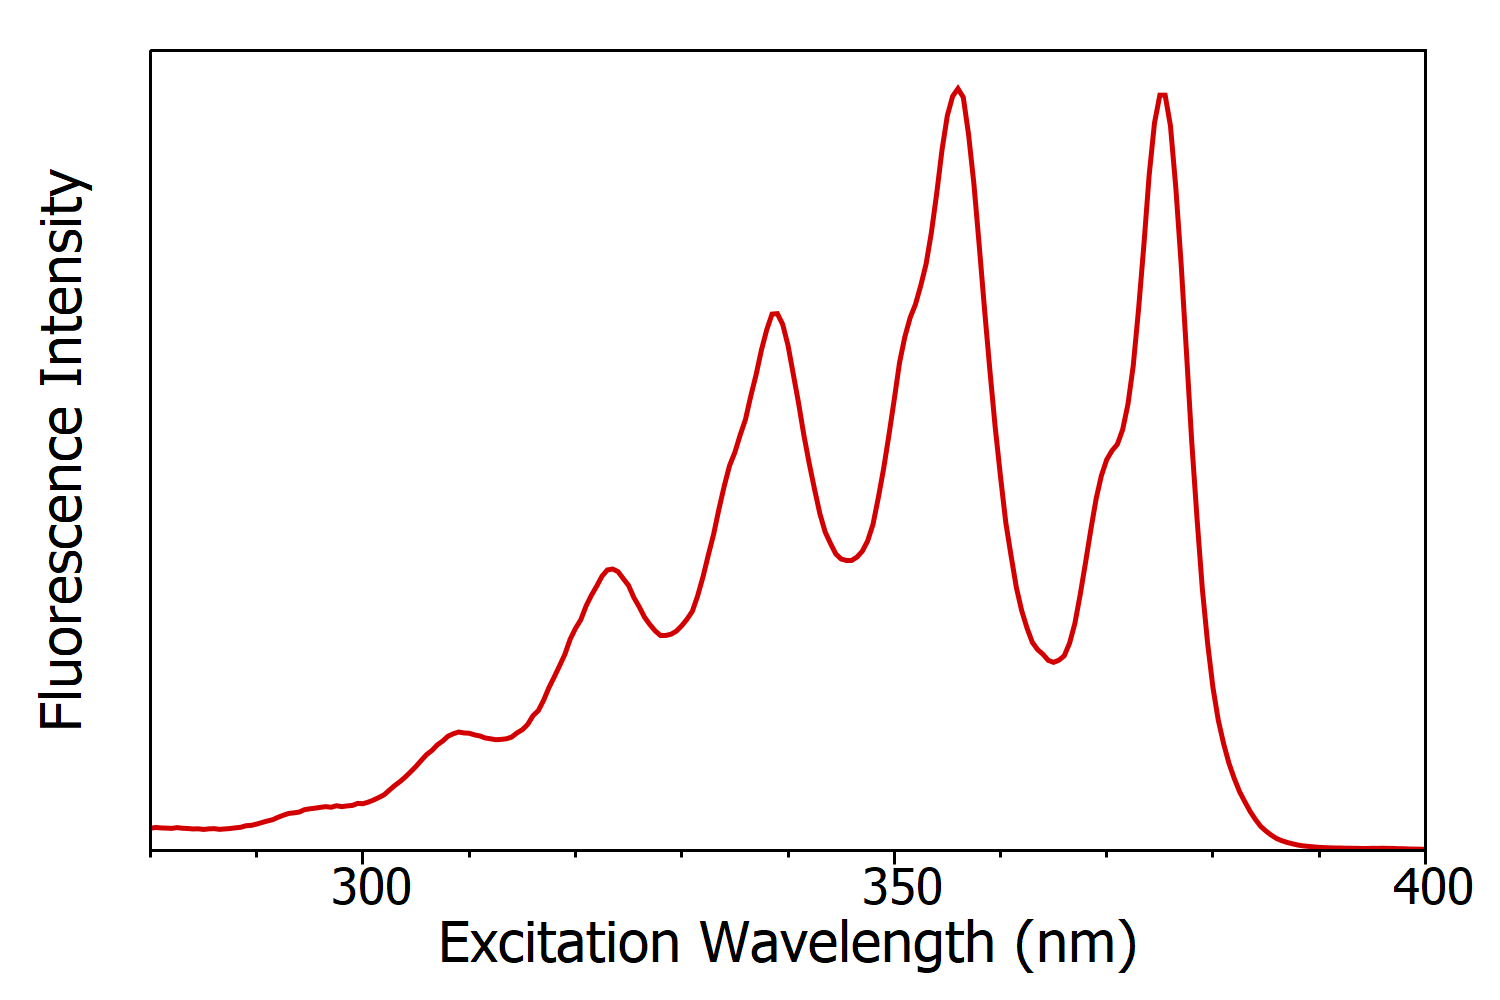
Figure 3: Fluorescence excitation spectrum of anthracene in cyclohexane measured using the FS5 Spectrofluorometer. Experimental parameters: λem = 420 nm, Δλem = 1 nm, Δλex = 1 nm.

Figure 4: Schematic of the measurement of excitation spectra in a spectrofluorometer.
Emission Spectra

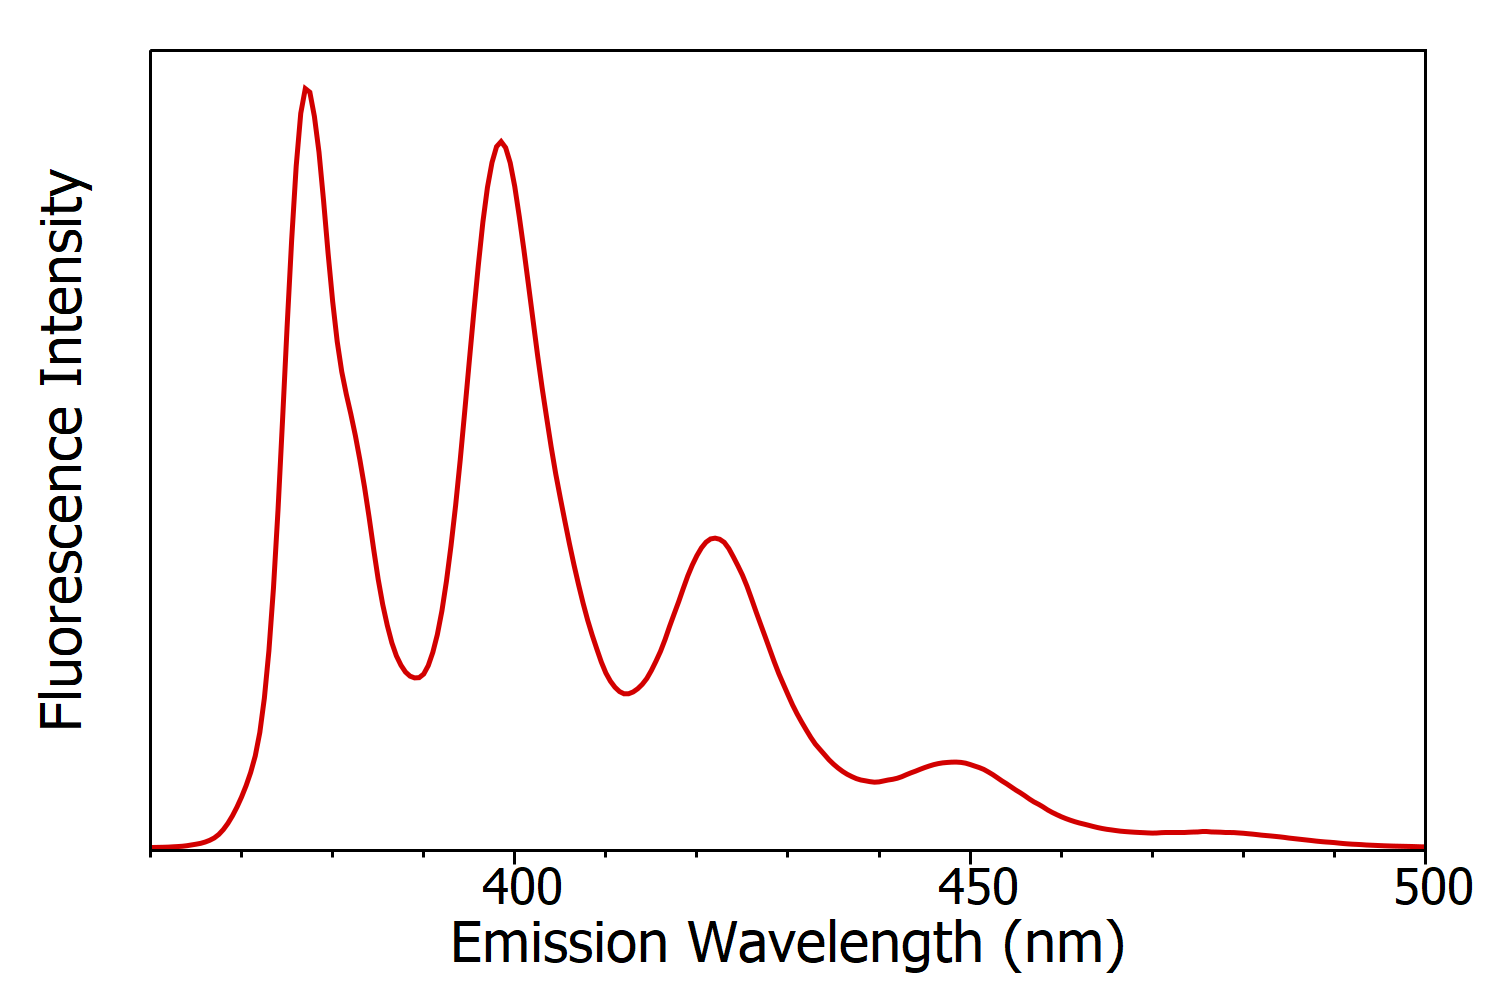
Figure 5: Fluorescence emission spectrum of anthracene in cyclohexane measured using the FS5 Spectrofluorometer. Experimental parameters: λex = 340 nm, Δλex = 1nm, Δλem= 1 nm

Figure 6: Schematic of the measurement of emission spectra in a spectrofluorometer.
