

Home· · ·Techcomp college· · ·Application notes
Application notes
Scion AN145 –Cannabis Potency analysis by HPLC
Introduction
Hemp and marijuana are becoming more popular because of legalization in multiple countries. The increase of this market also increases the offer of products that contain very different levels of cannabinoids than the content described on the label. Therefore, as quality control it is important to monitor the level of cannabinoids.
This application focusses on the analysis of potency using the HPLC. SCION Instruments has an extended portfolio including potency analysis with an FID (AN091, 92, 93 and 130), GC-MS (AN142)terpene analysis (AN133 and 136) and Residual solvents analysis (AN139).
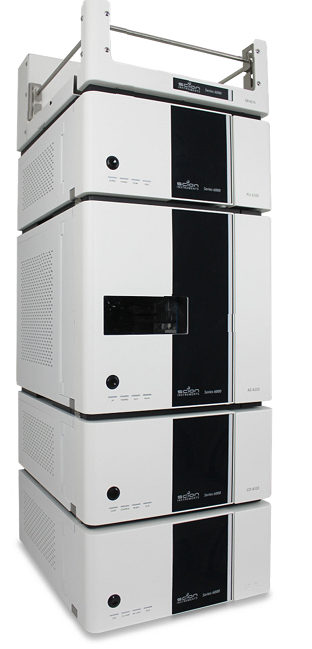
Figure 1 shows the SCION Instruments LC 6000 with UV detector on which this method is applicable to.
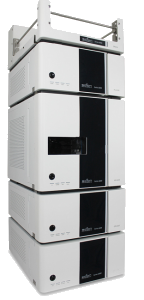
Figure 1. SCION Instruments LC 6000.
Experimental
This analysis can be implemented on the SCION Instruments LC6000 equipped with a quaternary pump, column oven and UV detector.
The analysis of these components can be done using a GC with a mass spectrometer (MS) or FID detector. Unfortunately, CBDV, CBGA, THC-A and CBDA cannot be detected with the FID or MS without extra sample preparation due to decarboxylation caused by the heat of the injector. The HPLC is a perfect instrument to measure these components since it does not use heat for the injection.
Using the potency analysis it is possible to identify and measure their concentration as an indication of the strength of the product. There are over 500 chemical compounds in Cannabis, the most tested cannabinoids are discussed in this application note: CBC, CBD, Δ8-THC, Δ9-THC, CBG, CBN, THC-A, CBDA, CBDV and CBGA.
Consumer hemp generally comes in the form of hemp oil which is used for medical purposes while marijuana is often smoked. Keep in mind that both samples need different sample preparation before analysis due to the difference in sample matrixes.
Cannabis oil only needs to be diluted with methanol, for the medical marijuana a bit more preparation is necessary.

Table 1. Potency components.
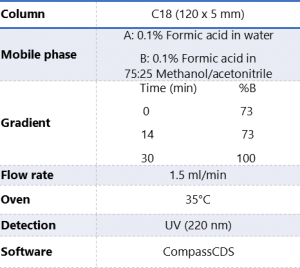
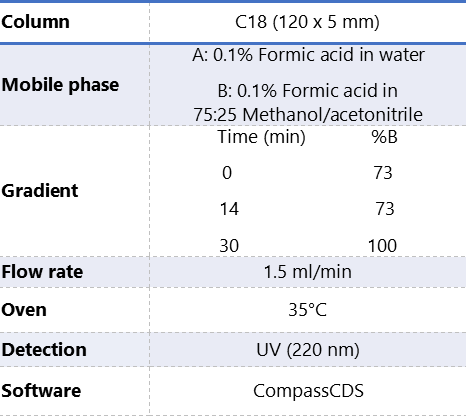
Table 2. Instrumentation operating conditions.
In order to extract the potency from the medical marijuana, it had to be dried for 2 hours, after that it had to be grinded. 30 ml of methanol was added and placed in an ultrasonic bath for 30 minutes. Evaporate to dryness, reconstitute in methanol.
The Quality Control (QC) sample was made from 15 μg/ml for all components.
Results
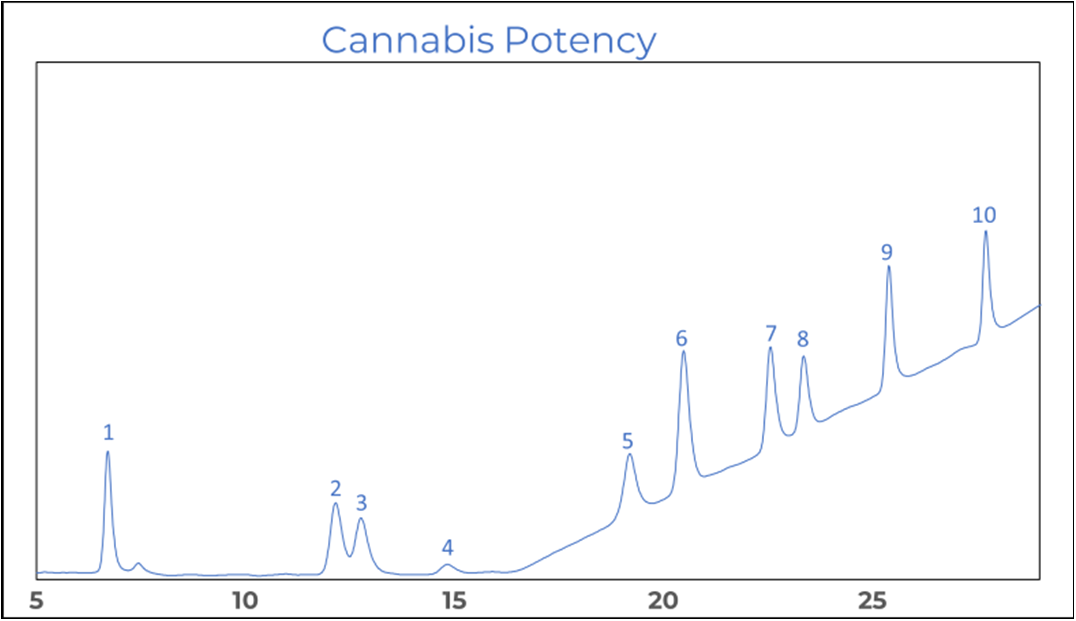
When looking at the chromatogram in figure 2 it shows that CBD and CBG are not base line separated. The two components have a resolution bigger than one, this however is sufficient for accurate quantitation.
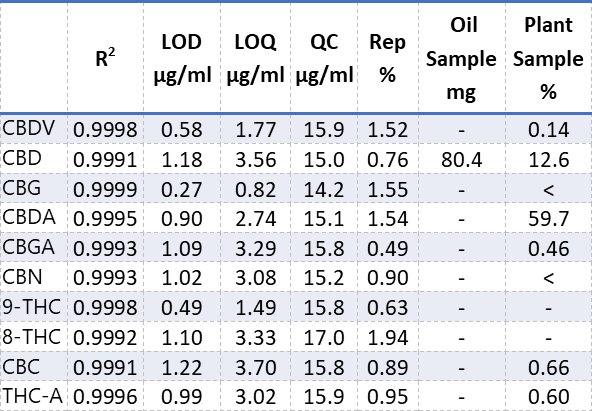
The precision of this method was obtained by seven consecutive injections containing 50 μg/ml of each component. It was shown that the RSD% for all components lie below 2% (table 3), which is an excellent result.
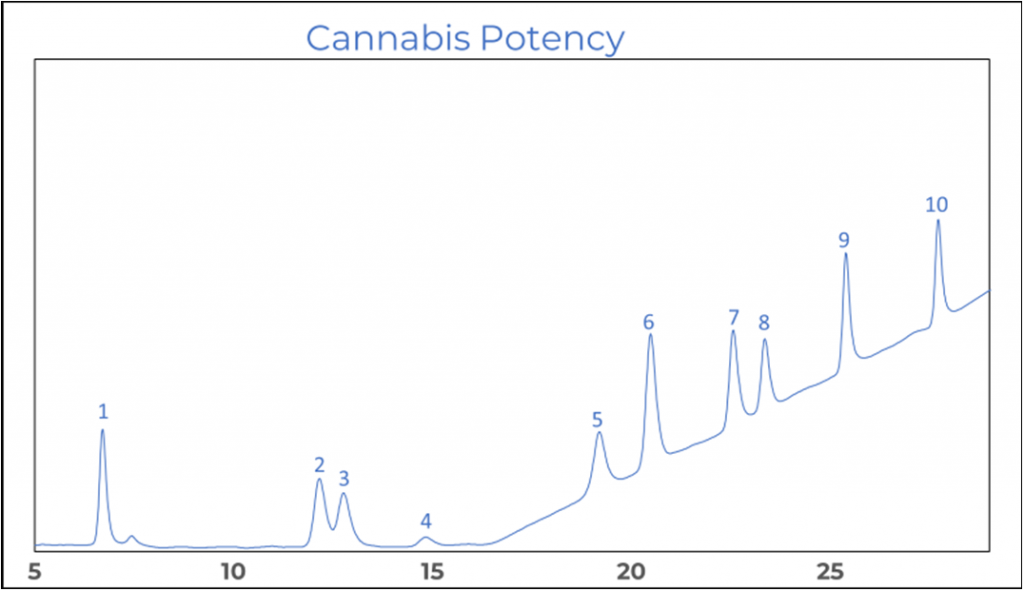
Figure 2. Chromatogram of a potency standard.
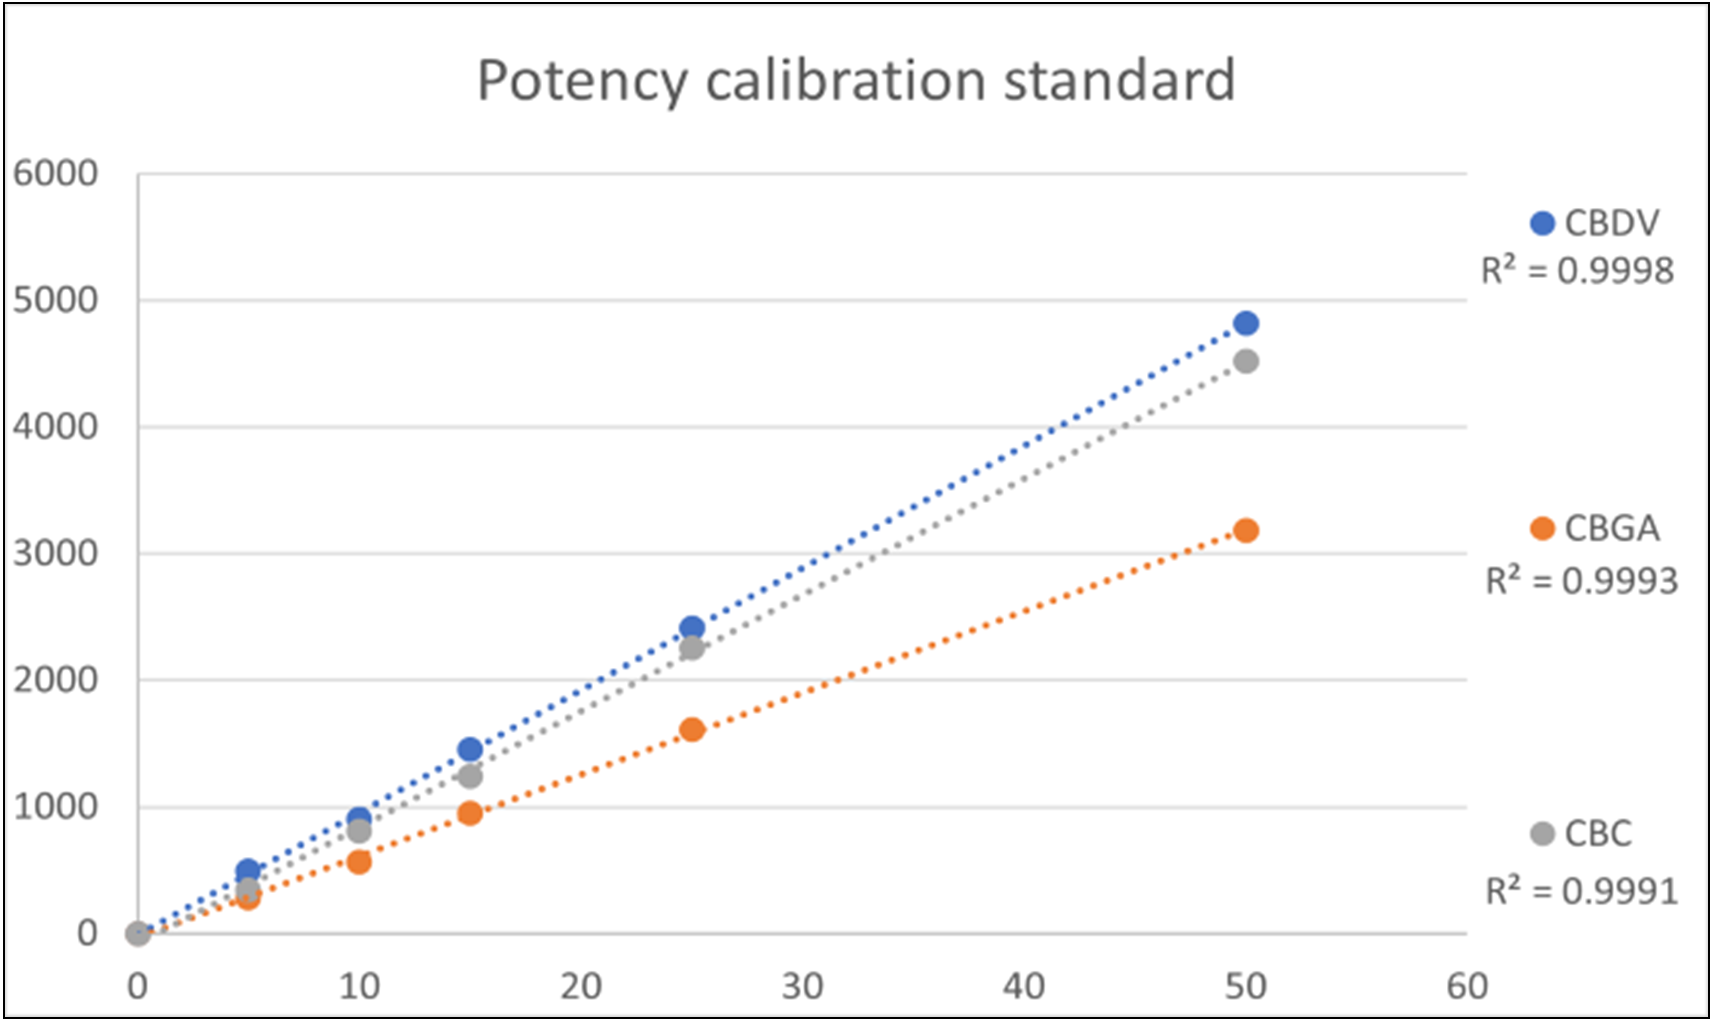
The calibration curves for the potency standards were prepared between 5 to 50 μg/ml. All the potency components had a correlation (R2) greater than 0.999 (table 3) which is perfect for this application. Figure 3 shows the calibration curves for three of the components.
From the linearity the limit of detection (LOD) and limit of quantitation (LOQ) were calculated. The QC control sample was analysed using multiple injections, the average concentrations are shown in table 3 together with the LOD and LOQ.
According to the label of the oil sample it should contain 100 mg of CBD, other components were not mentioned on the label. After analysis it showed that the oil sample contained 80.4 mg CBD, no further components were detected.
The medical marijuana did not come with an index stating it’s content. Analysis showed it contained: 0.14% CBDV, 12.6% CBD, 59.7 % CBDA, 0.46 % CBGA, 0.66% CBC and 0.60% THC-A. CBG and CBN were present below LOD.

Figure 3. Calibration curves of three potency standards.

Table 3. Results of different potency components.
Conclusion
The SCION Instruments LC 6000 equipped with
a quaternary pump, column oven and UV detector. Is perfectly capable of potency
analysis in a qualitative and quantitative way.
The HPLC is well suited to perform even the analysis of the acidic potency components, a GC is only capable of measuring the non-acidic components.
Product Info: Scion LC6000 HPLC
Scion Official Website: https://scioninstruments.com/cannabis-potency-analysis-by-hplc/

 2606, 26/F., Tower 1, Ever Gain Plaza, 88 Container Port Road, Kwai Chung, N.T., Hong Kong
 +852-27519488 / WhatsApp/WeChat HK: +852-8491 7250
 techcomp@techcomp.com.hk
 Sweep The Concern Us