Home· · ·Techcomp college· · ·Application notes
Application notes
Hitachi AI – FL190002 – Measurement of quantum yield in-plane distribution with EEM® View
Measurement of quantum yield in-plane distribution
Technique for calculation of in-plane distribution of quantum yield
from fluorescence and reflection images
A spectrofluorometric microscope (EEM?View) system can observes samples and acquire spectra. Using an integrating sphere, samples can be observed under uniform lighting conditions. The fluorescence spectrum is acquired by the fluorescence-side spectroscope, and the same time, reflection and fluorescence images from the fluorescent sample are capture by the CMOS camera unit at the lower part of the integrating sphere.
The quantum yield, an indicator of the luminous efficiency, of a fluorescent sample, is calculated from the amount of excitation light absorbed and the amount of fluorescent emission. This instrument can determine the in-plane distribution of quantum yield y calculating the amount of absorption from the sample reflection image and the amount of fluorescence from the fluorescence image.
To determine the in-plane distribution of quantum yield
- The absorption distribution is determined from the white board image and the reflection image.
- The fluorescence distribution is determined from the fluorescence image.
- The in-plane distribution of quantum yield is calculated from the absorption and fluorescence distributions


For details of the procedure and calculation, please
download the application note in PDF format.

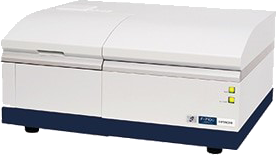
Hitachi F-7100 Fluorescence Spectrophotometer
Product Info: Hitachi F-7100 Fluorescence Spectrophotometer


 2606, 26/F., Tower 1, Ever Gain Plaza, 88 Container Port Road, Kwai Chung, N.T., Hong Kong
 +852-27519488 / WhatsApp/WeChat HK: +852-8491 7250
 techcomp@techcomp.com.hk
 Sweep The Concern Us