Home· · ·Techcomp college· · ·Application notes
Application notes
TAN-UV001 – Spectrophotometric analysis of iodine vapour by Techcomp UV2600 UV/Vis spectrophotomete
Scope
The electronic spectra of small molecules in the gaseous state often reveal many molecular rotation and vibration lines. The analysis of these spectra can give a lot of molecular structure information and the potential energy curve of the ground state and excited electronic state. The visible absorption spectrum of iodine molecular vapour in the 500 nm-650 nm range is always a good example.
As the resolution of the UV-Vis spectrophotometer increases, this spectral structures will show up. In this experiment, we use the Techcomp UV2600 ultraviolet-visible spectrophotometer. We can change the resolution of the instrument by changing the slit width of the instrument, and do the visible absorption spectrum scan of iodine vapour.
Instrument
Techcomp
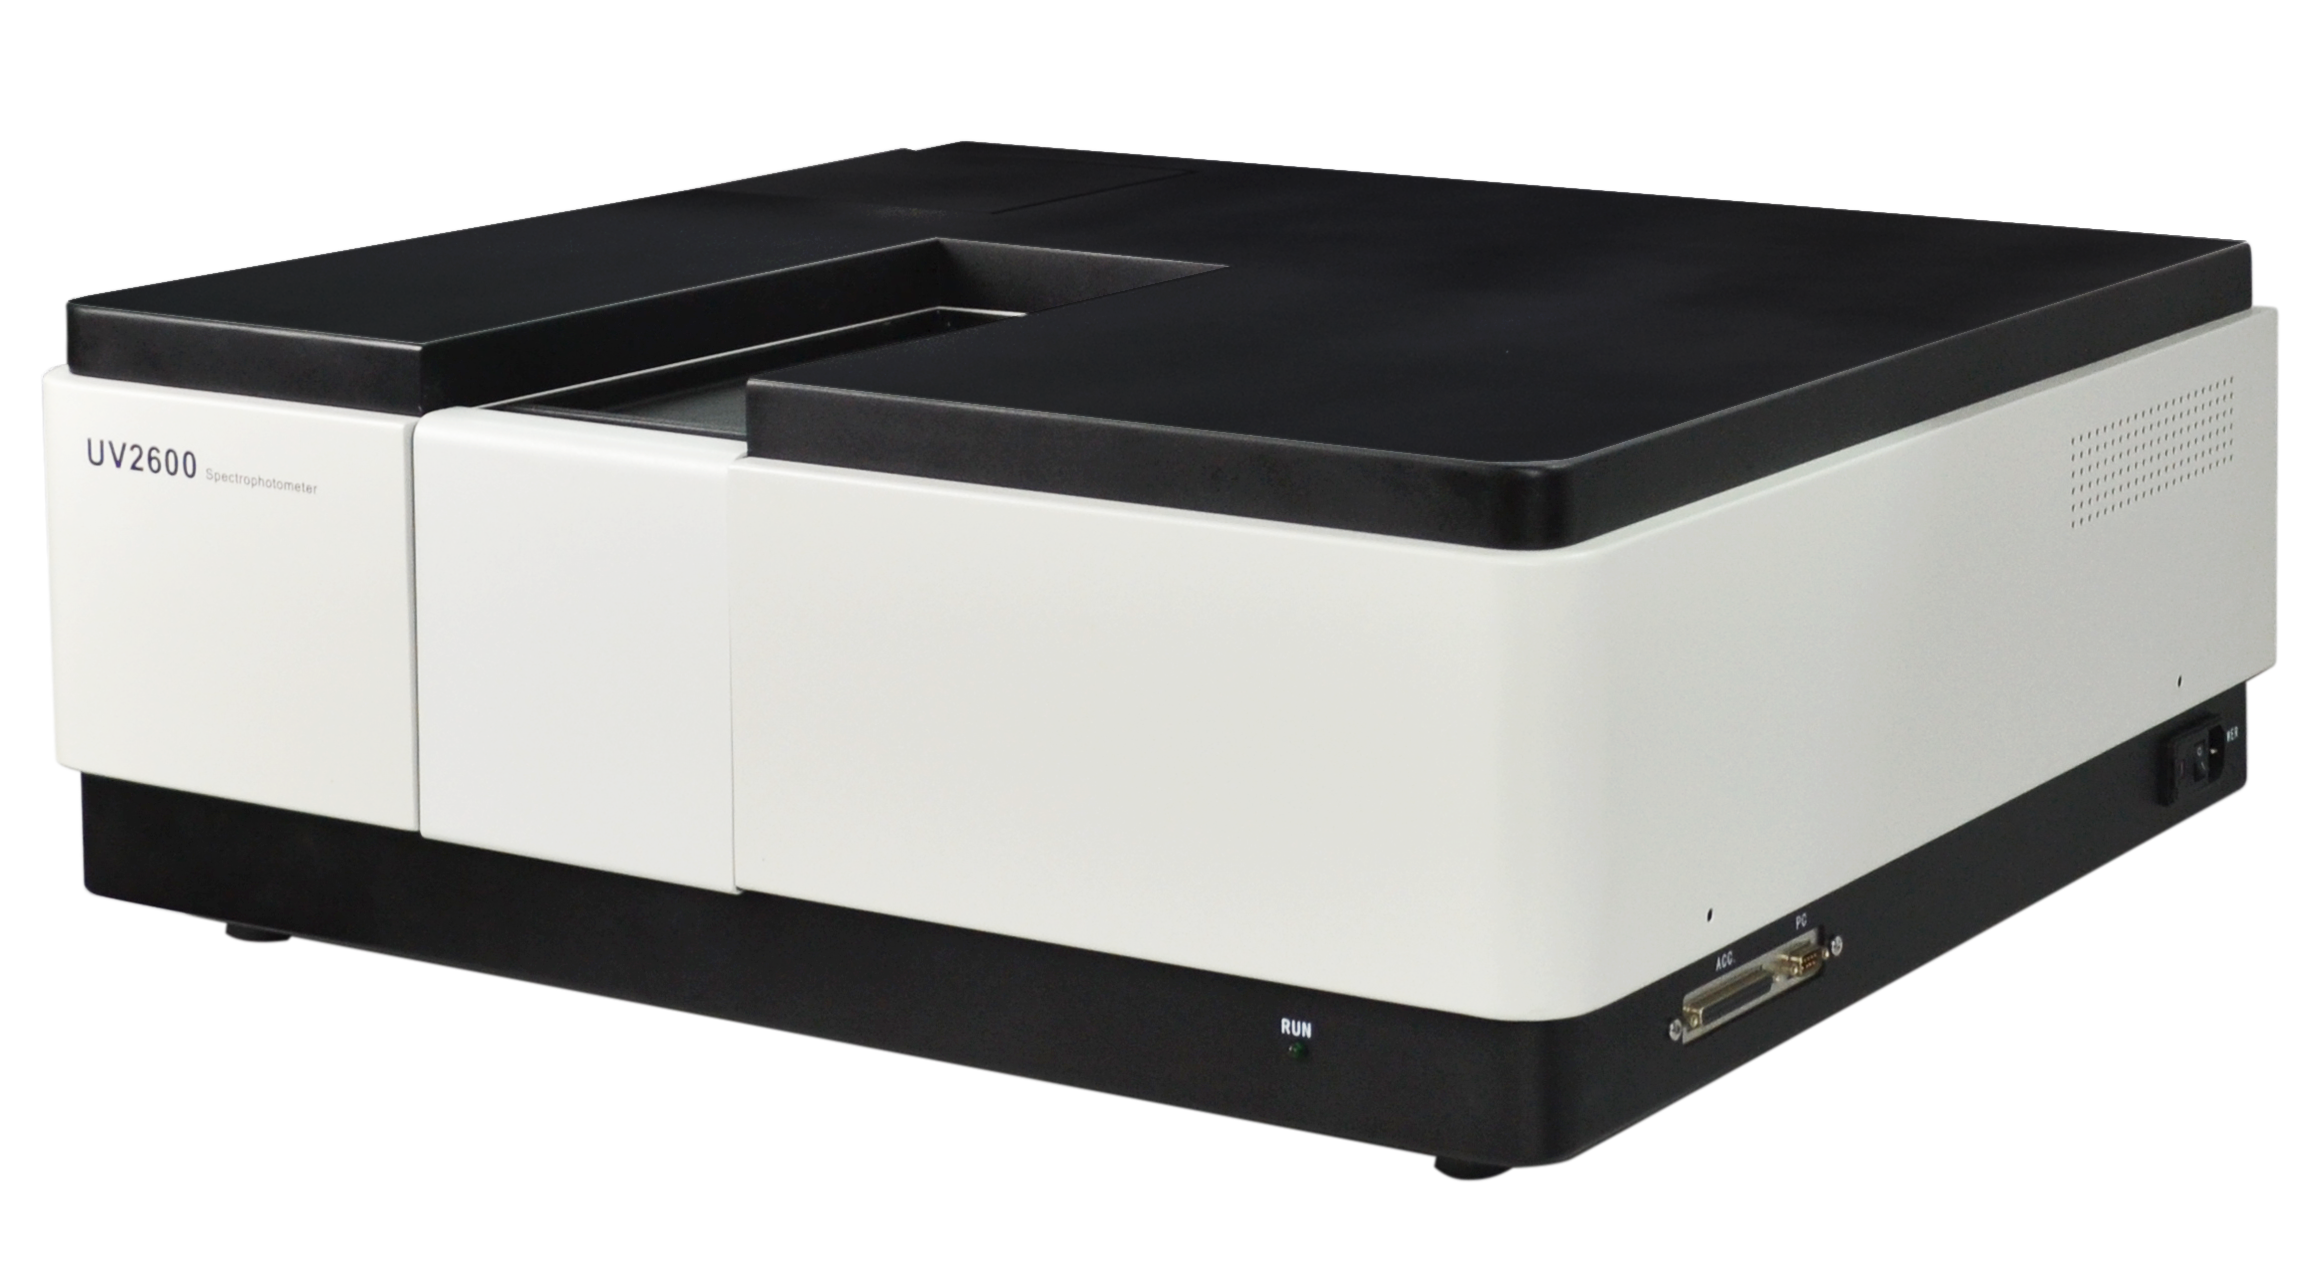
UV2600 UV/Vis spectrophotometer
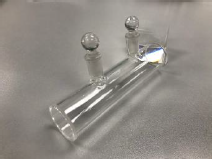
Cuvette
: optical quartz cuvette (190-2500nm), dimension : 45×12.5×102.5mm (HxWxD),
length path : 100mm
Reagent and material
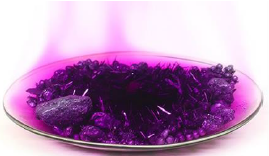
Iodine
(solid)
Test protocol
Add a small amount of solid iodine to the cuvette, seal the cuvette, and then heat it with a hot dryer for 5 minutes. The cuvette is filled with iodine vapour and put inside the sample compartment of UV2600. Change the slit width of the instrument from 0.1 nm to 0.2 nm, 0.5 nm, 1.0 nm, 2.0 nm, 5.0 nm d in sequence, and other parameters are tested consistently.
Instrumentation
parameters
Test mode: Wavelength scan
Data mode: ABS
Start wavelength : 650 nm
End wavelength : 500nm
Scanning speed : 20 nm/min
Interval: 0.05
Experimental result and discussion
Absorption spectra of iodine vapour under different slit widths:
Figure 1
: Absorption spectrum of iodine vapour at 0.1nm slit width
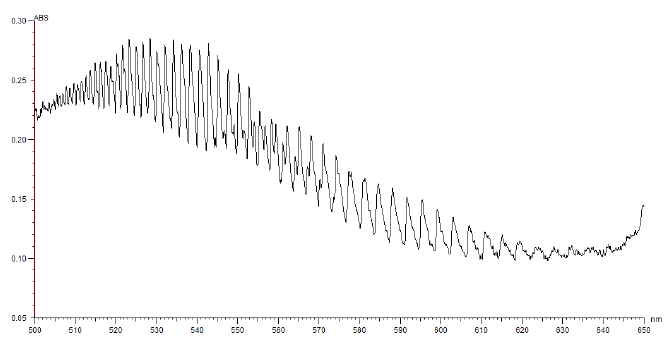
Figure 2
: Absorption spectrum of iodine vapour at 0.2nm slit width
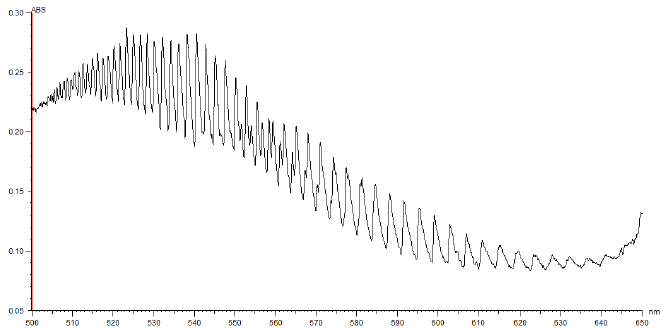
Figure 3
: Absorption spectrum of iodine vapour at 0.5nm slit width
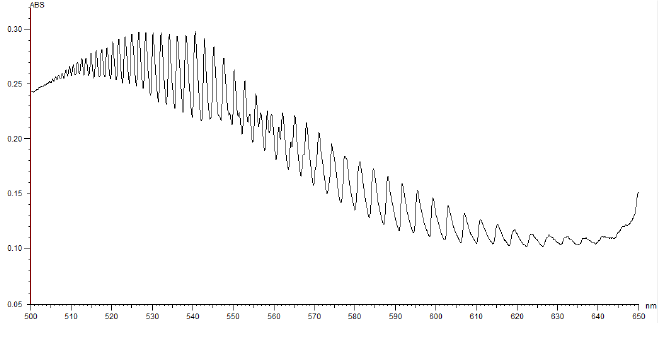
Figure 4 : Absorption spectrum of iodine vapour at 1.0nm
slit width
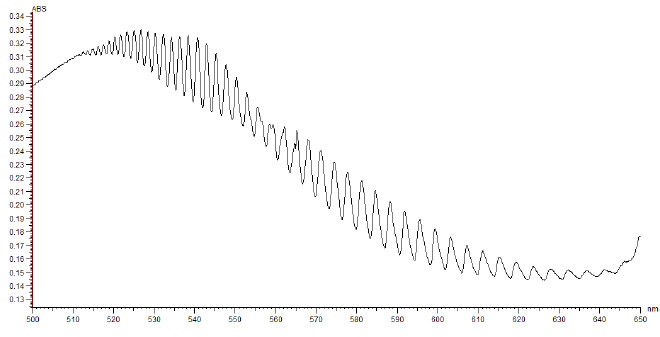
Figure 5
: Absorption spectrum of iodine vapour at 2.0nm slit width
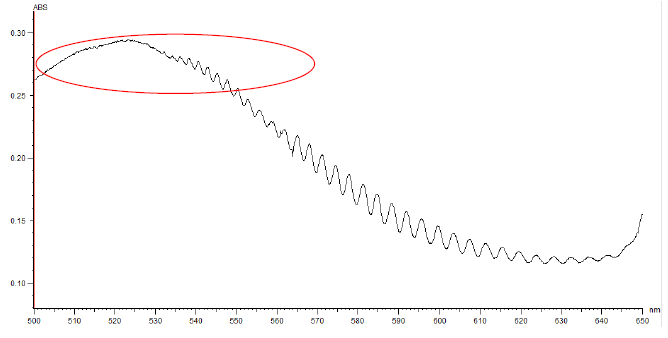
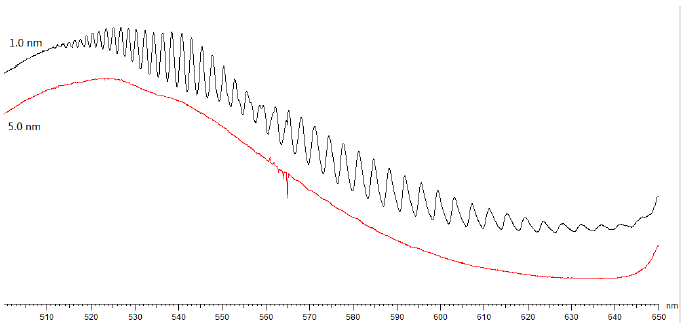
Figure 6
: Absorption spectrum of iodine vapour at 5.0nm slit width
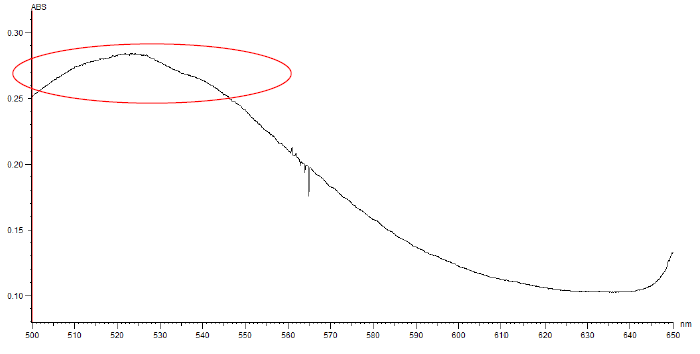
Figure 7 : Comparison of iodine vapor spectra in the
range of 500 - 520nm under different slit widths
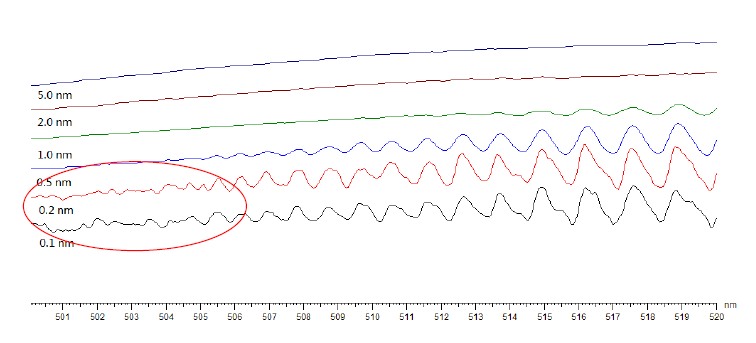
Figure 8
: Comparison of the iodine vapour spectra under the slit width of 0.1 nm and
1.0 nm
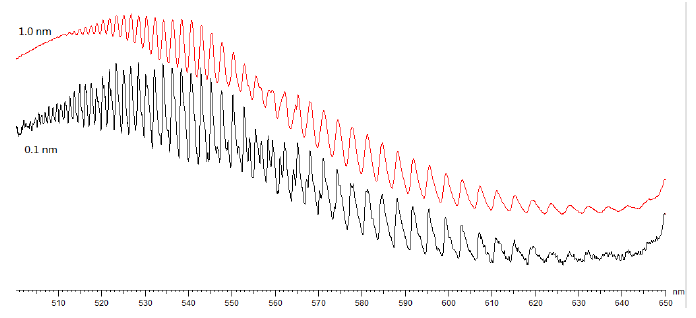
Figure 9
: Comparison of the iodine vapour spectra under 1 nm and 5 nm slit width
Conclusion
The absorption spectrum of iodine vapour under each slit width is shown in Figure 1-6. From the experimental results, we compare and overlay the iodine vapour spectra (500-520 nm) under different slit widths as shown in Figure 7. The vibration amplitude of the iodine vapour spectrum is obviously weakened by increasing of the slit width. A very clear vibration band can be seen in the range of 500 nm-520 nm under the slit width of 0.1 nm. The vibration amplitude is slightly weakened at 0.2 nm slit width. When the slit width increases to 2.0 nm, the vibration in the 500 nm-520 range has not been detected. Consequently, the vibration amplitudes of the overall vibration bands of 0.5 nm, 1.0 nm, and 2.0 nm gradually weaken by increasing the slit width. Until the slit width increases to 5 nm (as shown in Figure 6), there is no vibration in the scanning range.
As a summary, we can characterize the special structure of the iodine vapour under high resolution test conditions. The change of spectral bandwidth which is proved, and bring different resolution effects by Techcomp UV2600.
Download Application Note
Download the complete Application Note:


 2606, 26/F., Tower 1, Ever Gain Plaza, 88 Container Port Road, Kwai Chung, N.T., Hong Kong
 +852-27519488 / WhatsApp/WeChat HK: +852-8491 7250
 techcomp@techcomp.com.hk
 Sweep The Concern Us