

Home· · ·Techcomp college· · ·Application notes
Application notes
EEM View -CMOS camera imaging system for Fluorescence Spectrophotometer
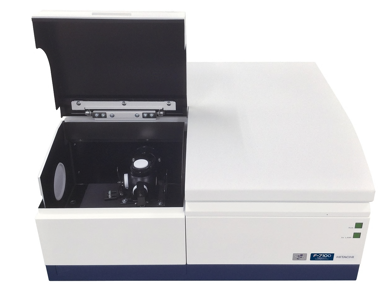
EEM View is a completely new concept system in the world which delivers fluorescence, reflection spectra and these images simultaneously. To make it possible, AI technology is applied to analyze data with a special algorithm*1. This measurement is possible by installing the EEM View Accessory on the F-7000 / 7100 Fluorescent Spectrophotometer.
"EEM" is a trademark of Hitachi High-Tech Science
Corporation, registered in Japan and China.
New technology capable of capturing fluorescence and reflection images and spectra of a sample simultaneously.
· - Measurement of spectrum data for samples (spectral and fluorescence properties).
· - Captures images under white light or
monochromatic light
(area: Φ20 mm, wavelength range: 380 to 700 nm)
· - Displays separated fluorescence and reflection images obtained using an analysis algorithm that applies AI technology
· - Displays spectra for each partition in an
image
(fluorescence spectrum and reflection spectrum)
- Fluorescence Spectrophotometer equipped with CMOS
camera imaging system -
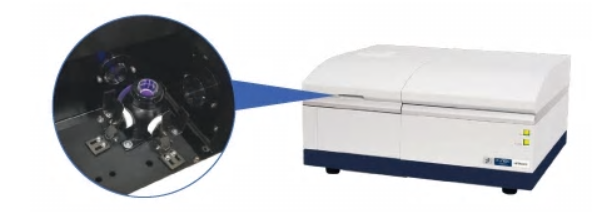
Uniform illumination system using an integrating sphere
Captures fluorescence and reflection images and spectra of samples simultaneously!
· -Diffusion of illumination using integrating sphere
· -Highly uniform illumination of samples
· -Dual detection using fluorescence spectroscope and CMOS camera
A
spectrofluorometric microscope is an option that can be attached to the sample
chamber of the existing Model F-7100 fluorescence spectrophotometer equipped
with CMOS camera.
Fluorescence properties and morphology of microstructured material
A fluorescent reflective sheet with a microstructure to improve its visibility was measured.
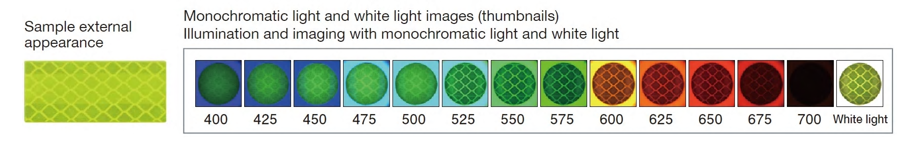
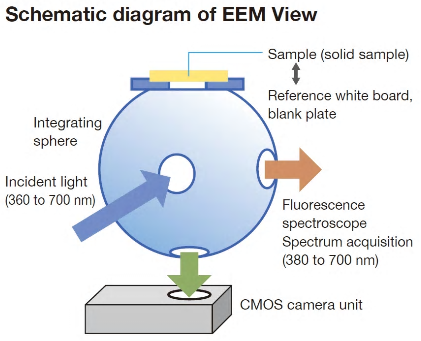
The sample is illuminated with monochromatic light at wavelengths
of 360 to 700 nm and with white light. An image is captured under each
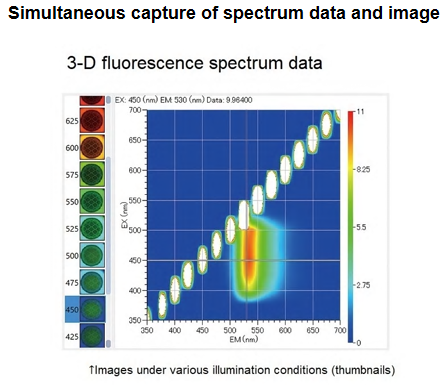
illumination condition, and the fluorescence spectrum is simultaneously
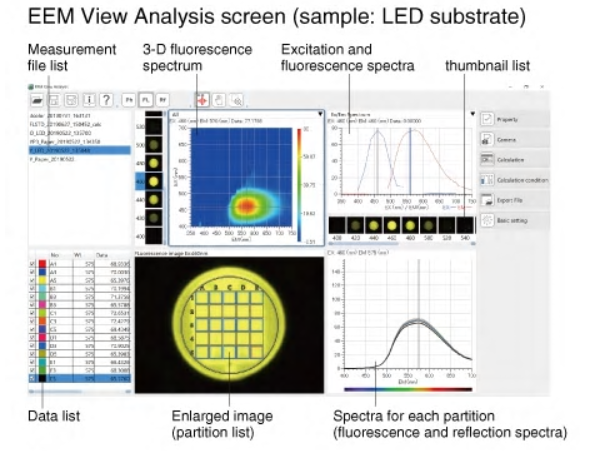
acquired by the fluorescence-side spectroscope. After measurement, the 3-D
fluorescence spectra are displayed (excitation wavelength, fluorescence
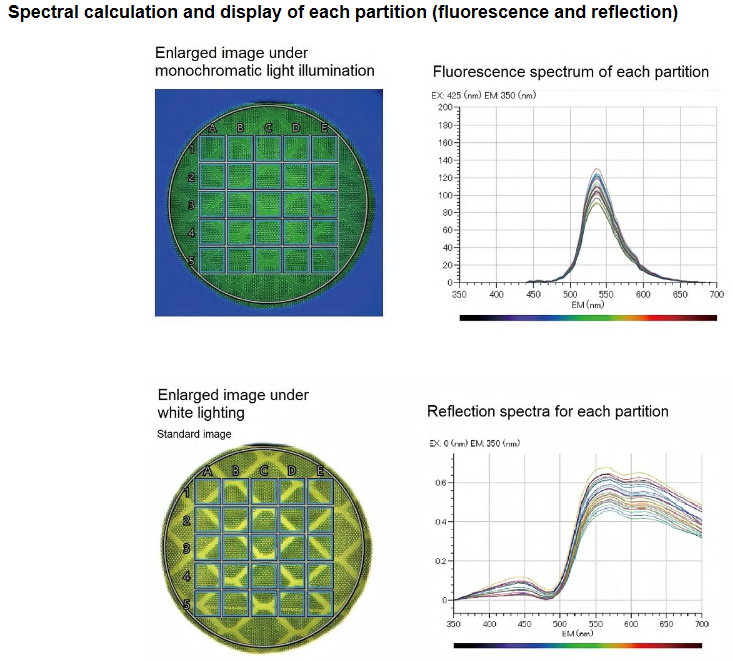
wavelength, and fluorescence intensity). An enlarged image and fluorescence and
reflection spectra for each partition can be displayed using the dedicated
analysis software. The reflection and fluorescence distribution of samples with
in-plane non uniformity can be captured as images and spectra.
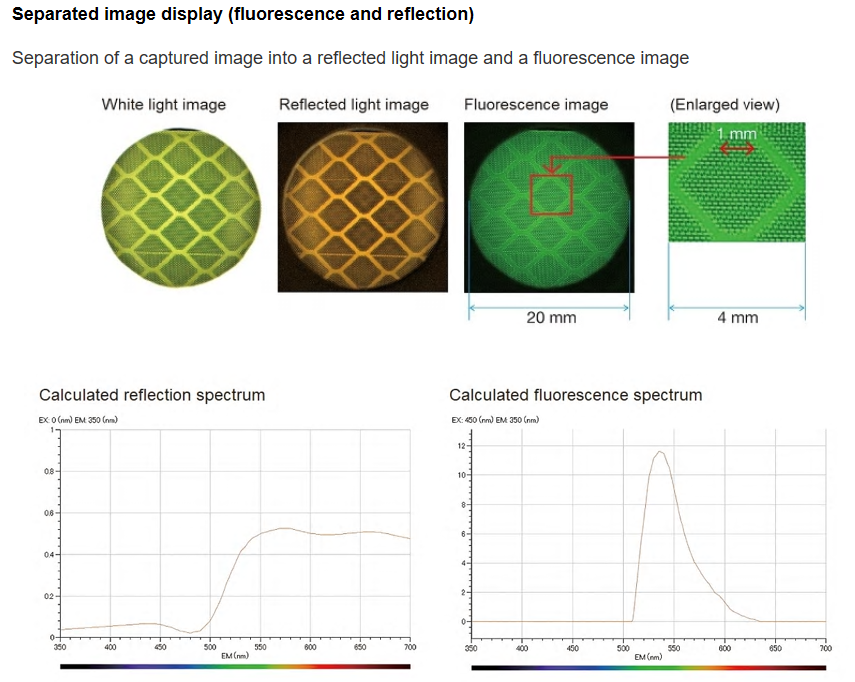
A captured image was separated into a reflected light image and a fluorescence image using an image separation algorithm. The reflection image was orange and the fluorescence image was green. The separated images correspond to the reflection spectrum and fluorescence spectrum, respectively, and by summing the orange reflection image and the green fluorescence image, the sample appears yellowish. It was found that the in-plane optical characteristics (optical pattern) in the reflection image and the fluorescence image were different. When the image was enlarged, it could be seen that the microstructure of the reflecting plate had a period of about 200 μm.
For more information on Hitachi FL, please visit Hitachi High-Tech Science website
https://www.hitachi-hightech.com/global/products/science/ai/

 2606, 26/F., Tower 1, Ever Gain Plaza, 88 Container Port Road, Kwai Chung, N.T., Hong Kong
 +852-27519488 / WhatsApp/WeChat HK: +852-8491 7250
 techcomp@techcomp.com.hk
 Sweep The Concern Us