Home· · ·Techcomp college· · ·Application notes
Application notes
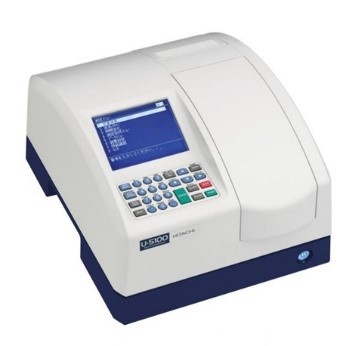
Analysis of DNA by by U-5100 UV/VIS Spectrophotometer
Analysis of DNA by U-5100 UV/VIS Spectrophotometer
DNA shows absorption in a specific
wavelength region. Therefore the absorbance measurement allows the
concentration determination and purity confirmation. The absorbance of 1 at 260
nm generally indicates 50 pg of double-stranded DNA (dsDNA), 33 pg of single-stranded
DNA (ssDNA), or 40 pg Of RNA and thus, a nucleic acid concentration can be
calculated based on the absorbance at 260 nm. Furthermore, as the absorption
maximum for proteins occurs at 280 nm, by calculating with respect to the
nucleic acid absorbance at 260 nm and comparing with the expected value the purity
can be confirmed from the protein contamination ratio. This time Lambda DNA was
analyzed by using a commercially available disposable micro cell.
Absorbance
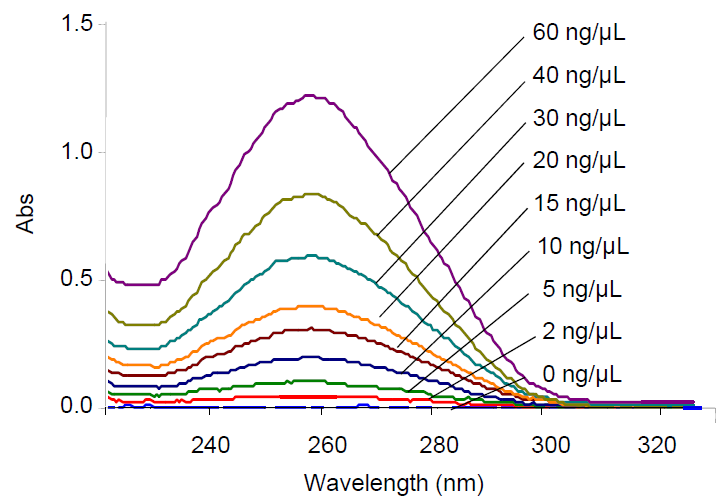
Spectrum Measurement for Lambda DNA
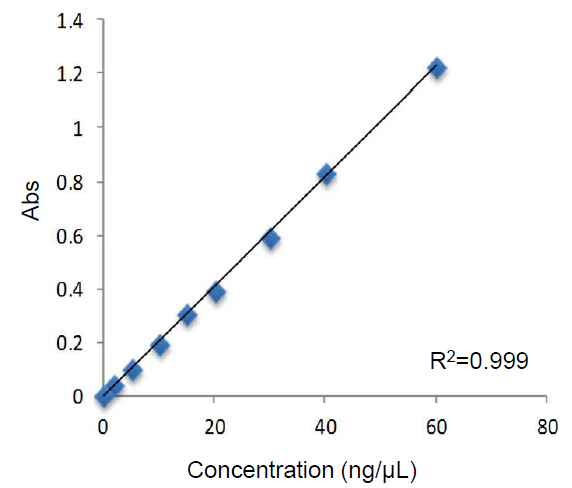
When a calibration curve of Lambda DNA was
prepared for the range of 2 – 60 ng/μL, a good correlation result (R2 = 0.999) was obtained.
The absorbance ratio (A260/280) for Lambda
DNA 30ng/μL was 1.96. For DNA, 1.8 or
higher ratio is considered high purity and thus, it was indicated that the
purity of this sample was high.
By selecting the low speed for the response
under the analytical conditions, the noise can be reduced.
Analytical Conditions
|
Instrument |
U-5100 UV/VIS Spectrophotometer |
|
Measurement wavelength range |
230-330 nm |
|
Scan speed |
200 nm/min |
|
Slit |
5 nm |
|
Sampling interval |
1 nm |
|
Response |
Low speed |
Accessory
|
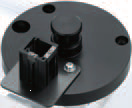
Single cell holder (p/n 3J2-0110)
|
Sample
Sample: Lambda DNA
Solvent: TE buffer (10nM Tris HCl, 1nM EDTA)
Calibration Curve of Lambda DNA

Absorption Spectrum of Lambda DNA

Product information:


 2606, 26/F., Tower 1, Ever Gain Plaza, 88 Container Port Road, Kwai Chung, N.T., Hong Kong
 +852-27519488 / WhatsApp/WeChat HK: +852-8491 7250
 techcomp@techcomp.com.hk
 Sweep The Concern Us