

Home· · ·Techcomp college· · ·Maintenance Center
Maintenance Center
How to study the fluorescence spectrum of a sample
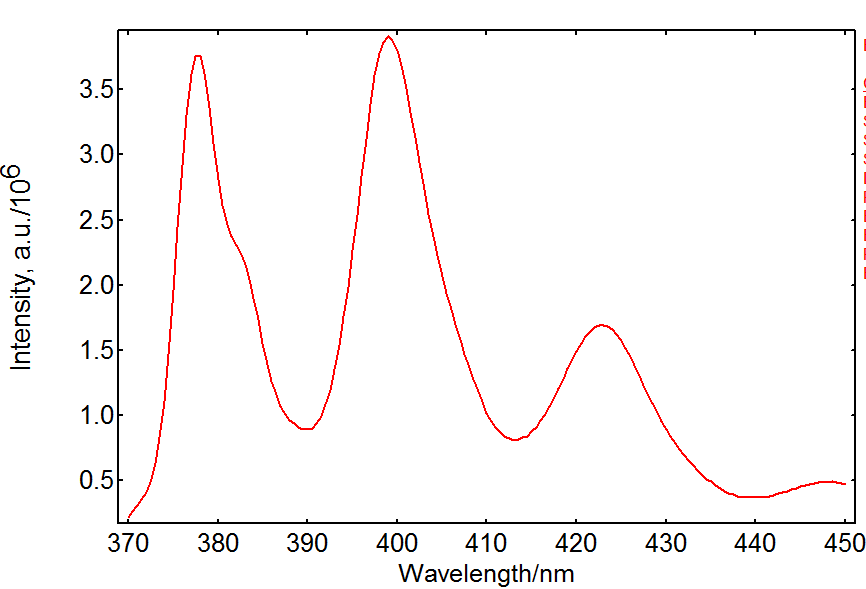
The instrument software plots the data as it acquires it, resulting
in a fluorescence spectrum like the one pictured below.
Fluorescence
spectroscopy is a widespread analytical technique, but dealing with unknown
samples can often be challenging even for experienced users. Below is a
procedure for spectral measurements to help newcomers to fluorescence
spectroscopy. EI posts on the inner
filter effect and spectral
measurements troubleshooting contain further advice on measurements.
When
dealing with an unknown sample it is good practice to start with a measurement
of its absorbance. Fluorescence is directly proportional to absorbed light so
the wavelength of maximum absorption should be determined. Some fluorescence
spectrometers such as the Edinburgh Instruments FLS1000 or FS5 models allow
absorbance as well as fluorescence measurements. It is a good idea to choose a
shorter excitation wavelength than this maximum, as there might be some overlap
between excitation and emission spectra.
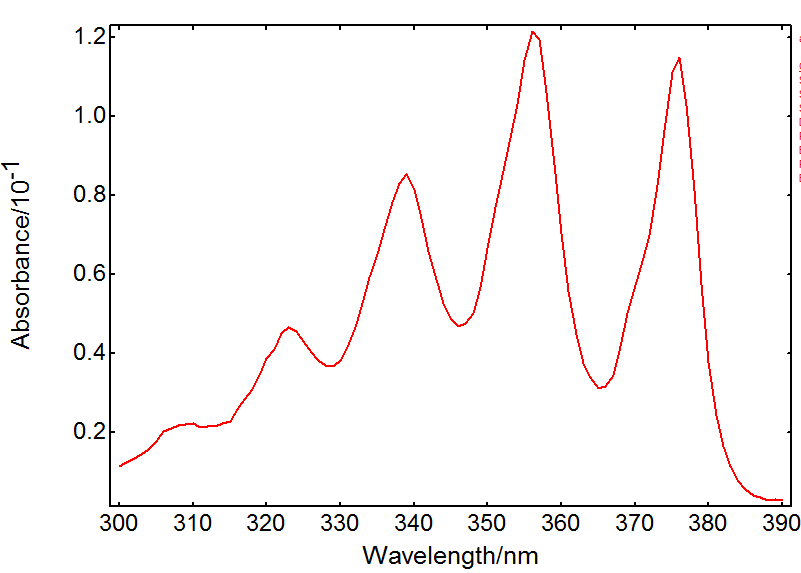
The
example above shows an absorption spectrum of anthracene in cyclohexane
acquired in an FS5 spectrofluorometer. The maximum absorbance is approximately
0.1 which is a good concentration to avoid the inner filter effect. Based on this, the excitation wavelength could
be set to ~355 nm or ~375 nm.
Next,
the absorption and emission wavelengths must be optimised to maximise the
signal of interest. The slits of the excitation and emission monochromators can
be adjusted to let more light through. This increases the signal but in turn reduces
the spectral resolution (i.e. how well-resolved the spectral lines are). The
signal should be high to obtain a good signal-to-noise ratio, but it should be
below the detector saturation limit:
too many photons per second can alter the detector behaviour and distort the
data. The saturation limit for a standard PMT detector is 1.5 million cps
(counts per second).
Once
the conditions have been optimised, the measurement parameters can be set in the
spectrometer software. Edinburgh Instruments spectrometers allow setting the wavelength
range, step size, dwell time and repeats as shown in the measurement window
below. The dwell time (integration time per data point and scan) and number of
scans contribute to the total integration time; obviously longer integration
times will increase the quality of the data. Background subtraction and
correction options are also available in the dialog.
The instrument software plots the data as it acquires it, resulting
in a fluorescence spectrum like the one pictured below.


 2606, 26/F., Tower 1, Ever Gain Plaza, 88 Container Port Road, Kwai Chung, N.T., Hong Kong
 +852-27519488 / WhatsApp/WeChat HK: +852-8491 7250
 techcomp@techcomp.com.hk
 Sweep The Concern Us